Departmental Results Report 2017-2018
Download as PDF (491 KB)
- © Her Majesty the Queen in Right of Canada, as represented by the President of the Treasury Board, 2018
- Catalogue No.: SC100-10E-PDF
- ISSN: 2561-1143
Minister's message

As the Minister responsible for the Canada School of Public Service (the School), I am proud to present the School's Departmental Results Report for fiscal year 2017–2018 (i.e. April 1, 2017 to March 31, 2018). This report shows how the School has fulfiled its mandate to build individual and organizational capacity and management excellence across the public service, which is essential to our work to better serve Canadians.
Revitalized by 3 years of major change, the School's relevant, responsive and accessible common curriculum has continued to promote a culture of learning across public service organizations nationwide. This work aligns with key government priorities including renewed Indigenous relationships, digital government, diversity and inclusion, Gender-based Analysis Plus, project management and healthy workplaces.
Through its broad range of learning activities, the School has supported employees in cultivating the skills and mindsets that will carry the public service beyond Canada 150. Together, we are embracing digital government, experimenting with innovative approaches, and grounding decisions in solid evidence.
The School has carried out 2 significant exercises in 2017–2018 to assess the success of its efforts to date and provide a foundation for ongoing improvements. The findings of these reviews, together with the Departmental Results Framework approved by the Treasury Board in November 2017, will provide a benchmark to measure future progress as the School continues to address emerging learning needs and enhance the learning experience for public servants.
Learning will always be a cornerstone of the public service as it strives to renew its ranks and deliver results for Canadians. By keeping employees on top of their evolving environment and creating a space for learning, collaboration and innovation, the School remains a key partner in strengthening public service excellence.
To find out more about the School's activities and the learning opportunities it provides to public service employees, please visit its website at www.myschool-monecole.gc.ca.
Results at a glance
What funds were used?
$76,289,634
Actual Spending
Who was involved?
580
Actual full-time equivalents
How did we do?
159,858
Total unique learners
505,734
Total registrations
In 2017–2018, the Canada School of Public Service provided relevant, responsive and accessible common learning nationwide. These courses, events, tools and resources equip public servants with the knowledge and skills they need to serve Canadians with excellence.
The following are highlights of the School's achievements in 3 priority areas:
Public service-wide learning
- Supported government priorities—including renewed Indigenous relationships, digital government, diversity and inclusion, Gender-based Analysis Plus, project management and healthy workplaces—through a range of learning opportunities
- Developed a standard, centralized approach to maintaining the relevance and responsiveness of School learning products
The learning experience
- Hosted nearly 500 learning events all across Canada, reaching more than 40,000 learners, and provided 367 learning products in person and online to nearly 160,000 individual public servants ("unique learners")
- Enhanced delivery and improved access, especially to classroom offerings in the regions
Innovation for results
- Experimented with new methods and tools such as micro-learning, podcasts and interactive videos to enhance the user experience and the impact of learning
For more information on the Canada School of Public Service's plans, priorities and results achieved, see the "Results: what we achieved" section of this report.
Raison d'être, mandate and role: who we are and what we do
Raison d'être
The School has a legislative mandate to provide a range of learning activities to build individual and organizational capacity and management excellence within the public service.
Mandate and role
The School was established on April 1, 2004, under the Public Service Modernization Act and operates under the authority of the Canada School of Public Service Act (CSPS Act). It has one strategic outcome: Federal public service employees have the common knowledge, skills and competencies to fulfil their responsibilities in serving Canadians.
The School is mandated to:
- encourage pride and excellence in the public service
- foster a common sense of purpose, values and traditions in the public service
- support deputy heads in meeting the learning needs of their organizations
- pursue excellence in public management and administration
In this regard, the School acts much like a corporate training and development institution for the federal public service. It supports common public service learning at all levels nationwide and across 99 federal departments and agencies, allowing them to focus on delivering mandate-specific training and development.
To deliver on the Prime Minister's mandate for the President of the Treasury Board and Minister of Digital Government, the School promotes a culture of measurement, evaluation and innovation in its program design and delivery. The organization also grounds its own decisions in meaningful data and indicators, allowing the School to better monitor progress and pave the way for the results expected from a high-performing and professional public service.
Reflecting the whole-of-government scope of its mandate, the School also provides common learning linked to government priorities including renewed Indigenous relationships, digital government, diversity and inclusion, Gender-based Analysis Plus, project management and healthy workplaces, among others. Its programming fosters public service excellence and supports the government's agenda.
For more general information about the department, see the "Supplementary information" section of this report. For more information on the department's organizational mandate letter commitments, see the Minister's mandate letter.
Operating context and key risks
Operating context
2017–2018 was a year of transition and achievement for the Canada School of Public Service. It marked the conclusion of 3 years of major change and the full implementation of a new business model for common learning. The School is now primarily funded by a stable base of appropriations, which is complemented by cost recovery.
The change initiative streamlined the School's curriculum. It is now better able to meet the common learning needs of the federal public service and support government priorities while departments and agencies focus on delivering mandate-specific learning.
The School also continued to build on the successful launch of its digital learning platform, GCcampus. This platform offers a wide range of learning opportunities to public servants anytime, anywhere and in both official languages. New digital technologies have made it possible for the School to deliver more learning online instead of in the classroom, increasing access to learning for public servants.
The School also made several internal changes to ensure it has the right capacity in the right places to make the organization as effective and efficient as possible. Specifically, it simplified its executive structure to improve the alignment of its learning program and internal services. These measures also included improving processes to allocate financial resources and monitor their use.
Furthermore, the School undertook a Departmental Review pursuant to Budget 2017 as well as other initiatives to begin charting the School's future path.
- A third party was engaged to carry out a summative evaluation of the 3-year change initiative. The evaluation found that the School had largely met its objectives and pointed out areas for improvement in data collection and reporting to client departments.
- The Office of the Commissioner of Official Languages conducted an audit of learning at the School. The resulting report concluded that the School had enhanced learning activities in both official languages and highlighted further ways to enhance the design, promotion and availability of learning activities.
Key risks
The School managed a number of risks in 2017–2018 relating to its ability to provide common learning that meets the needs of the public service. These risks reflected the challenges the School faced in designing, developing, and delivering its common curriculum to respond to those needs.
Key risks
This table outlines key risks for the year and the mitigating actions taken by the School to manage each of them.
| Risks |
Mitigating strategy and effectiveness |
Link to the department's Programs |
Link to mandate letter commitments and any government-wide or
departmental priorities |
Implementing a whole-of-government approach to learning that is seamless within federal organizations and across the public service
Due to the rapid pace of transformation of the learning platform and the range of new learning products coming on stream, there is a risk that organizations and public service employees may not be fully aware of the relevant learning opportunities available to them. |
- The School launched a client research survey to gain insight into learning needs and expectations. The survey will inform the development of a plan to raise public servants' awareness of the School's learning offerings.
- The School promoted a culture of innovation, intelligent risk taking, service excellence, delivery of results and employee development by providing learning and fostering engagement across the public service.
|
1.1 Program: Learning Services and Internal Services |
Contributing to the development of a more engaged, innovative and agile public service (Blueprint 2020) |
Meeting new learning needs and priorities requires a constantly evolving and adaptable approach to learning
There is a risk that the learning demands and new priorities will outpace the School's capacity to design and deliver. |
- Through consultations, the School confirmed that the framework for its common curriculum remains relevant and responsive to government priorities and public service learning needs.
- The School took steps to re-establish a standardized curriculum management function to ensure that learning products will remain relevant, responsive, accurate, and aligned with government priorities and learners' needs.
- The School collaborated with other government departments, academic institutions and non-governmental organizations.
|
1.1 Program: Learning Services and Internal Services |
Contributing to the development of a more engaged, innovative and agile public service (Blueprint 2020) |
Improved accessibility and learner experience is dependent on a modernized physical and technological learning environment
There is a risk that the physical and technological learning environment will not support full accessibility and a positive learning experience. |
- In close collaboration with Public Services and Procurement Canada, the School continued to modernize and ensure the accessibility of its facilities across Canada to provide a positive experience for all learners.
- The School continued to work with Shared Services Canada to ensure that its digital learning platform is accessible anytime and anywhere with minimal performance issues or outages.
- The School continued to experiment with new technologies and learning methods to improve the learning experiences of public servants.
|
1.1 Program: Learning Services and Internal Services |
Contributing to the development of a more engaged, innovative and agile public service (Blueprint 2020) |
Results: what we achieved
Programs
Learning Services
Description
The School offers learning opportunities for all public service employees. It is transforming its learning platform and products to support a more modern approach to learning so that public service employees are supported in acquiring the common skills and knowledge they need to deliver real, positive change for Canadians. This includes greater use of technology-enabled learning products and tools.
Results
In 2017–2018, the School focused on 3 priority areas:
1. Public service-wide learning
The School continued to deliver a streamlined curriculum that supports government priorities and responds to the common learning needs of public servants nationwide. In 2017–2018, the School reached 159,858 unique learners,Endnote 1 with 505,734 registrations overall. A standard, centralized approach was also developed to manage the School's curriculum to ensure that learning products remain relevant and up to date.
Supporting government priorities, such as the following, remained a key focus:
- Renewed relationships with Indigenous Peoples. The School continued to develop and deliver its Indigenous Learning Series in response to the Truth and Reconciliation Commission's Call to Action #57, which calls on the government to educate public service employees on the history of Indigenous Peoples. The series includes a range of in-class learning activities, events, online tools and videos. To ensure the series accurately reflects the perspectives of First Nations, Inuit and Métis, and responds to learners' needs, the School engaged extensively with Indigenous representatives and employees across the public service who helped to co-develop learning products. Learning events hosted as part of the series were provided across Canada to learners in person and online.
- Digital government. The government's digital agenda and digital transformation were featured in a number of executive learning opportunities, including the School's key transition programs and special events held nationwide for all employees. The course Technology Savviness for Executives was launched with success and is being rolled out to executives across Canada. The School also collaborated with the Canadian Digital Service and the Treasury Board of Canada Secretariat's Chief Information Officer Branch to identify experts within and beyond the federal public service to offer seminars and workshops on this topic. The first Forum on Digital Government, an all-day event, was one of the learning opportunities the School delivered for all employees.
- Diversity and inclusion. The School delivered learning opportunities on these topics to more than 18,500 unique learners in class and online. These topics were also addressed by 52 events attended by learners nationwide.
- Gender-based Analysis Plus. The School worked with Global Affairs Canada's Centre for Intercultural Learning to deliver 11 workshops across the country. In collaboration with Status of Women Canada, the School also provided access to courses, job aids, tools and other projects and initiatives.
- Mental health in the workplace. The School's learning strategy on mental health, delivered in partnership with the Canadian Centre for Occupational Health and Safety, used events, online tools and instructor-led products to foster awareness of this issue at all levels. This included a series of online courses which more than 4,500 public servants registered for nationwide.
- Results and delivery. The School delivered events, webinars and case studies in support of the government's results and delivery agenda. Among them was a discussion with leading results and delivery expert Sir Michael Barber, an event attended by senior leaders and practitioners in December 2017.
- Project management. In collaboration with the Treasury Board of Canada Secretariat and other key stakeholder departments, the School conducted a needs analysis as a first step towards enhancing its project management curriculum. This will create a foundation for a new curriculum in early 2018–2019 to support renewed policy on planning and managing investments.
- Leadership. Through a revitalized leadership curriculum, the School enabled more than 6,000 public servants to adapt to career transitions at various levels and meet the challenges of a changing public service landscape. In addition, the Executive Leadership Development Programs provided 100 executives with hands-on experience to develop their leadership competencies. The programs provided both classroom sessions and study tour opportunities to engage with subject-matter experts and stakeholders from various government and non-governmental sectors, including Indigenous leaders and Elders.
2. The learning experience
The School delivers learning events—both in person and virtually—as a key component of its common curriculum. Events are the School's most agile and timely delivery method to respond to public servants' learning needs. The School reached more than 40,000 learners through almost 500 learning events held all across Canada (120 in the National Capital Region and 376 in other regions).
Key examples included:
- the National Orientation Event for Summer Students (3,000 learners)
- the Manion Lecture, which focused on strengthening Canadians' trust in the public service (1,054 learners)
The School also continued to convert some instructor-led courses into online learning products. Most of the School's learning products are now available online, with 275 online self-paced products and 92 classroom courses. As a result, 74% of learning hours in 2017–2018 were delivered online, compared with 26% in classroom offerings and events.
GCcampus: Digital Learning Platform
- 1.4 million learning sessions in 2017–2018
- Online registrations increased by 18.6% from 2016–2017
- Top 3 online courses:
- Creating a Respectful Workplace: Online Self-paced (27,908 registrations)
- Security Awareness (27,411 registrations)
- Fundamentals of Information Management (22,769 registrations)
Although the School has reduced the number of classroom learning products by more than half since 2013–2014, the 92 classroom products it offered were more effective, more relevant and delivered more frequently. In fact, total access to instructor-led learning increased overall, particularly in the regions. Classroom products continue to play a key role in programs that aim to change behaviour, such as the School's offerings on topics like leadership development. The School made a particular effort to increase the number of classroom offerings in the regions, with 54% of classroom offerings delivered in 59 locations across Canada and the remaining 46% in the National Capital Region. This is more in line with the regional distribution of public servants.
In addition, 18 regional webcasts were delivered from locations across Canada to reach 365 learners in person and 5,474 online. On average, each of these webcasts was attended by 30 learners in person, with 456 unique connections online. The School also held 21 Learning Weeks across Canada, up from the 13 that were held in 2016–2017 in Ontario, the Northwest Territories and Nunavut. These weeks dedicated to learning feature a series of instructor-led courses, events and workshops to public servants working outside of the School's 13 points of service.
The School continued to build upon its client relationships across the country to meet the needs of public servants. The School worked with partners like the National Managers' Community and the Federal Youth Network to deliver several learning events, such as Learning Days for Managers and the annual Career Boot Camp. In addition, the School collaborated with all Regional Federal Councils to deliver 10 regional Innovation Fairs in 12 cities across the country to highlight innovation and renewal stories.
3. Innovation for Results
In 2017–2018, the School also took steps to improve the user experience and functionality of GCcampus, the School's digital learning platform. Consultations with learners and internal stakeholders showed that learners want this platform to be mobile-friendly and integrated with other government platforms, such as the GCTools suite.
In response, the School modified its design approach for developing learning products. This means that new online learning products will be optimized for access on mobile devices.
To stay up to date with the latest trends in learning techniques and technologies, the School:
- experimented with new methods like micro-learning in the Indigenous Learning Series and inviting users to bring their own devices to classrooms and events
- explored using new tools and methods such as podcasts and interactive videos to support learners on the job
- invested in the infrastructure for the Innovation Lab and capacity for design thinking
- attended conferences and vendor demonstrations to find and test new tools and methods
The School has also advanced innovative partnerships with other organizations. For example, the School collaborated with several departments and Indigenous employee circles to establish micro-mission agreements and a subject-matter expert working group, which included 24 members from 11 organizations. These partnerships allowed the School to access this expertise to develop content, provide guidance and facilitate courses.
Finally, the School offered a variety of learning products on innovation and experimentation. These learning opportunities provided public servants with tools and skills for adapting to change, managing complex projects and supporting public service renewal and service excellence. One example was Creativity and Innovation in the Workplace, an online course delivered to 419 public servants in 2017–2018.
Results achieved
This table compares expected results with actual results, listing the performance indicators and targets by which results are measured, along with past results.
Expected
results |
Performance
indicators |
Target |
Date to
achieve target |
2017–2018
Actual results |
2016–2017
Actual results |
2015–2016
Actual results |
| Participants are able to apply what they learned "on the job." |
Participants are able to apply what they learned "on the job." Percentage of participants assessed who experience a change in behaviour "on the job" |
For the courses that were assessed, 60% of participants |
3-year
cycle |
91% of participants assessed are able to apply what they learned "on the job." |
94% of participants assessed are able to apply what they learned "on the job." |
79% of participants assessed are able to apply what they learned "on the job." |
| Knowledge is acquired through participation in the School's Learning Services program. |
Percentage of courses assessed that result in participant knowledge gain |
100% of courses assessed |
3-year
cycle |
Not availableNote* |
Not availableNote* |
100% of courses assessed resulted in participant knowledge gain. |
| Participants are satisfied with the School's Learning Services program activities. |
Percentage of participants assessed who are satisfied with the learning activities |
80% of participants assessed |
End of fiscal
year |
88% of participants assessed were satisfied with the learning activities. |
90% of participants assessed were satisfied with the learning activities. |
89% of participants were satisfied with the learning activities. |
Budgetary financial resources (dollars)
This table compares Main Estimates and planned spending with the actual spending for the year.
2017–2018
Main Estimates |
2017–2018
Planned spending |
2017–2018
Total authorities
available for use |
2017–2018
Actual spending
(authorities used) |
2017–2018
Difference
(actual minus planned) |
| 58,009,726 |
63,350,543 |
68,886,131 |
55,437,037 |
(7,913,506) |
Under Section 18(2) of the Canada School of Public Service Act, any unspent revenue in a given fiscal year can be carried forward and spent in the following fiscal year. The difference between "planned spending" and "Main Estimates" represents the amount that the School would use to fund expenditures using this authority.
Human resources (full-time equivalents)
This table compares planned and actual numbers of full-time equivalents for the year.
2017–2018
Planned full-time equivalents |
2017–2018
Actual full-time equivalents |
2017–2018
Difference
(Actual full-time
equivalents minus Planned
full-time equivalents)
|
| 410 |
421 |
11 |
The number of full-time equivalents was higher than planned by about 3%; however, overall spending in Learning Services was 12% below planned expenditures. Lower than planned spending in Learning Services is mainly due to the overall efficiency of the School's learning delivery model and reduced investments after the completion of the 3-year change initiative. 2017–2018 was a transition year to assess the results achieved, review the resources available and plan for investments in future years.
Internal Services
Description
Internal Services are those groups of related activities and resources that the federal government considers to be services in support of programs and/or required to meet corporate obligations of an organization. Internal Services refers to the activities and resources of the 10 distinct service categories that support Program delivery in the organization, regardless of the Internal Services delivery model in a department. The 10 service categories are: Management and Oversight Services; Communications Services; Legal Services; Human Resources Management Services; Financial Management Services; Information Management Services; Information Technology Services; Real Property Services; Materiel Services; and Acquisition Services.
Results
During the year, the School streamlined its executive cadre and moved towards a simpler, clearer, more integrated organizational structure. This was followed by the launch of a classification review of all non-executive positions.
The School implemented a new process to allocate financial resources and monitor their use. Budgets for operations and investments were allocated to cost centre managers early in the fiscal year to help them achieve their planned results. The School continues to refine its processes to allocate budgets in the timeliest way possible. Improvements on this front will have a direct impact on planning and achieving results.
Procurement planning was also streamlined to consolidate purchasing and establish multi-year contracts while ensuring resources are available when needed. Procurement planning effectively established larger contracts for information technology resources, helping to increase industry interest and improve the quality of the resources procured.
The School supported the public service priority of healthy and productive workplaces in a number of ways. In addition to the delivery of a mental health awareness curriculum for the public service, the School remained committed to workplace wellness and mental health within the organization. The School's initiatives in support of a healthy workplace included the following:
- developing a Mental Health Strategy in consultation with its subcommittee on psychological health and well-being, and connecting with other departments to explore best practices
- participating in a Joint Task Force on Mental Health to stay aligned with the Clerk of the Privy Council's priorities on mental health and workplace well-being
- holding 4 panel discussions on mental health issues to raise awareness among School employees, including a session called "Normalizing the conversation around mental health," which drew 419 webcast connections as well as 60 learners in person
- reviewing its practices for welcoming new employees to enhance engagement, improve employees' understanding of their roles and support employee wellness
Internal services budgetary financial resources (dollars)
This table compares Main Estimates and planned spending for Internal Services with the actual spending on Internal Services for the year.
2017–2018
Main Estimates |
2017–2018
Planned spending |
2017–2018
Total authorities
available for use |
2017–2018
Actual spending
(authorities used) |
2017–2018
Difference
(Actual spending minus
Planned spending) |
| 19,567,811 |
20,501,856 |
23,502,871 |
20,852,597 |
350,741 |
Under Section 18(2) of the Canada School of Public Service Act, any unspent revenue in a given fiscal year can be carried forward and spent in the following fiscal year. The difference between "planned spending" and "Main Estimates" represents the amount that the School would use to fund expenditures using this authority.
Overall spending in internal services was slightly higher than planned due to acquisition of equipment and furniture to modernize office space.
Internal services human resources (full-time equivalents)
This table compares planned and actual numbers of full-time equivalents for Internal Services for the year.
2017–2018
Planned full-time equivalents |
2017–2018
Actual full-time equivalents |
2017–2018
Difference (Actual full-time equivalents minus
Planned full-time equivalents)
|
| 187 |
159 |
(28) |
Lower than planned full-time equivalents in internal services reflects attrition and vacancies in corporate functions.
Analysis of trends in spending and human resources
Actual expenditures
Departmental spending trend graph
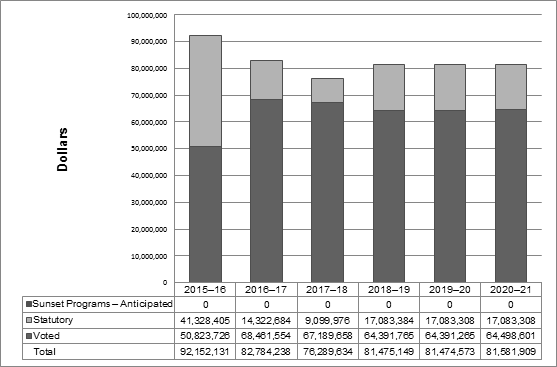
Text version
Departmental spending for statutory programs, broken down by voted and total amounts, is presented in a bar graph for fiscal years 2015–2016 to 2020–2021. The amounts are as follows:
2015–2016
- Sunset Programs – Anticipated: 0
- Staturory: 41,328,405
- Voted: 50,823,726
- Total: 92,152,131
2016–2017
- Sunset Programs – Anticipated: 0
- Staturory: 14,322,684
- Voted: 68,461,554
- Total: 82,784,238
2017–2018
- Sunset Programs – Anticipated: 0
- Staturory: 9,099,976
- Voted: 67,189,658
- Total: 76,289,634
2018–2019
- Sunset Programs – Anticipated: 0
- Staturory: 17,083,384
- Voted: 64,391,765
- Total : 81,475,149
2019–2020
- Sunset Programs – Anticipated: 0
- Staturory: 17,083,308
- Voted: 64,391,265
- Total: 81,474,573
2020–2021
- Sunset Programs – Anticipated: 0
- Staturory: 17,083,308
- Voted: 64,498,601
- Total: 81,581,909
In 2017–2018, the School emerged from 3 years of major change with a business model that maximizes digital learning delivery and a modernized curriculum. During those 3 years, the School's expenditures increased due to the investments required to complete the change.
2017–2018 was a transition year with reduced spending, since most investments related to the change initiative were completed in 2016–2017. The results of the significant review exercises undertaken in 2017–2018 will inform future investment decisions.
While these factors led to lower spending in 2017–2018, planned spending for future years is expected to increase as the School continues to invest in innovations to its learning platform and roll out new learning programs and innovative services.
Budgetary performance summary for Programs and Internal Services (dollars)
This table compares planned and actual spending on Learning Services and Internal Services in the current year to planned spending for the following two years and actual spending for the previous two years.
| Programs and Internal Services |
2017–2018
Main
Estimates |
2017–2018
Planning
spending |
2018–2019
Planning
spending |
2019–2020
Planning
spending |
2017–2018
Total
authorities
available
for use |
2017–2018
Actual
spending
(authorities
used) |
2016–2017
Actual
spending
(authorities
used) |
2015–2014
Actual
pending
(authorities
used) |
| Learning Services |
58,009,726 |
63,350,543 |
60,910,915 |
60,910,484 |
68,886,131 |
55,437,037 |
61,017,208 |
59,000,898 |
| Subtotal |
58,009,726 |
63,350,543 |
60,910, 915 |
60,910,484 |
68,886,131 |
55,437,037 |
61,017,208 |
59,000,898 |
| Internal Services |
19,567,811 |
20,501,856 |
20,564,234 |
20,564,089 |
23,502,871 |
20,852,597 |
21,767,030 |
33,151,233 |
| Total |
77,577,537 |
83,852,399 |
81,475,149 |
81,474,573 |
92,389,002 |
76,289,634 |
82,784,238 |
92,152,131 |
Under Section 18(2) of the Canada School of Public Service Act, any unspent revenue in a given fiscal year can be carried forward and spent in the following fiscal year. The difference between "planned spending" and "Main Estimates" represents the amount that the School would use to fund expenditures using this authority.
Actual human resources
Human resources summary for Programs and Internal Services (full-time equivalents)
This table compares planned and actual numbers of full-time equivalents for Learning Services and Internal Services in the current year to planned full-time equivalents for the following two years and actual full-time equivalents for the previous two years.
| Programs and Internal Services |
2015–2016
Actual full-time equivalents |
2016–2017
Actual full-time equivalents |
2017–2018
Planned full-time equivalents |
2017–2018
Actual full-time equivalents |
2018–2019
Planned full-time equivalents |
2019–2020
Planned full-time equivalents |
| Learning Services |
474 |
428 |
410 |
421 |
442 |
442 |
| Subtotal |
474 |
428 |
410 |
421 |
442 |
442 |
| Internal Services |
210 |
153 |
187 |
159 |
153 |
153 |
| Total |
684 |
581 |
597 |
580 |
595 |
595 |
As previously noted, reduced spending in 2017–2018 is primarily the result of wrapping up investments for change initiatives in 2016–2017. Spending and full-time equivalents are expected to increase in 2018–2019 as the School continues to implement new learning programs and innovative services.
Expenditures by vote
For information on the School's organizational voted and statutory expenditures, consult the Public Accounts of Canada 2017–2018.
Government of Canada spending and activities
Information on the alignment of the Canada School of Public Service's spending with the Government of Canada's spending and activities is available in the GC InfoBase.
Financial statements and financial statements highlights
Financial statements
The Canada School of Public Service's financial statements (unaudited) for the year ended March 31, 2018, are available on the departmental website.
Financial statements highlights
Condensed Statement of Operations (unaudited) for the year ended March 31, 2018 (dollars)
This table compares planned and actual expenses, revenues and net cost of operations for the current year and the previous year.
| Financial information |
2017–2018
Planned
results |
2017–2018
Actual |
2016–2017
Actual |
Difference
(2017–2018
Actual results minus
2017–2018
Planned results) |
Difference
(2017–2018
Actual results minus
2016–2017
Actual results) |
| Total expenses |
91,612,727 |
88,645,678 |
95,460,007 |
(2,967,049) |
(6,814,329) |
| Total revenues |
6,067,702 |
9,744,981 |
7,978,194 |
3,677,279 |
1,766,787 |
| Net cost of operations before government funding and transfers |
85,545,025 |
78,900,697 |
87,481,813 |
(6,644,328) |
(8,581,116) |
Actual spending decreased in 2017–2018 as a result of the completion in 2016–2017 of most of the investments related to the change initiative. Compared to the planned amount, the decrease is mainly due to lower operating expenses.
Revenue increased, compared to the previous year and the forecast amount, due to secured multi-year funding for the Executive Leadership Development Programs.
Condensed Statement of Financial Position (unaudited) as of March 31, 2018 (dollars)
This table compares financial assets and liabilities for the current year and the previous year.
| Financial information |
2017–2018 |
2016–2017 Restated |
Difference
(2017–2018 minus
2016–2017) |
| Total net liabilities |
14,520,039 |
15,489,114 |
(969,075) |
| Total net financial assets |
9,067,858 |
10,181,046 |
(1,113,188) |
| Departmental net debt |
5,452,181 |
5,308,068 |
144,113 |
| Total non-financial assets |
5,540,338 |
4,927,931 |
612,407 |
| Departmental net financial position |
88,157 |
(380,137) |
(468,294) |
| Note: Any minor numerical differences between Departmental Financial Statements and the above condensed version are due to rounding. |
The decrease in total net liabilities is mainly due to reduced accrued salaries.
Total net financial assets decreased mainly as a result of reduced receivables from other government departments.
The increase in total non-financial assets reflects the acquisition of furniture and the renovation of office space.
The overall net financial position of the School is better than the previous year due to the increase in non-financial assets, composed mainly of tangible capital assets.
Supplementary information
Corporate information
Organizational profile
Appropriate minister: The Honourable Scott Brison, President of the Treasury Board and Minister of Digital Government
Institutional head: Taki Sarantakis, President
Ministerial portfolio: Treasury Board
Enabling instrument: Canada School of Public Service Act, S.C. 1991, c. 16
Year of incorporation / commencement: 2004
Reporting framework
The Canada School of Public Service's Strategic Outcome and Program Alignment Architecture of record for 2017–2018 are shown below.
Supplementary information tables
The following supplementary information tables are available on the Canada School of Public Service's website:
Federal tax expenditures
The tax system can be used to achieve public policy objectives through the application of special measures such as low tax rates, exemptions, deductions, deferrals and credits. The Department of Finance Canada publishes cost estimates and projections for these measures each year in the Report on Federal Tax Expenditures. This report also provides detailed background information on tax expenditures, including descriptions, objectives, historical information and references to related federal spending programs. The tax measures presented in this report are the responsibility of the Minister of Finance.
Organizational contact information
Canada School of Public Service
373 Sussex Drive
Ottawa, Ontario K1N 6Z2
Canada
Telephone: 1-866-703-9598
Fax: 1-866-944-0454
E-mail: csps.registrar-registraire.efpc@canada.ca
Website: www.myschool-monecole.gc.ca Home Page
Appendix: definitions
- appropriation (crédit)
- Any authority of Parliament to pay money out of the Consolidated Revenue Fund.
- budgetary expenditures (dépenses budgétaires)
- Operating and capital expenditures; transfer payments to other levels of government, organizations or individuals; and payments to Crown corporations.
- Departmental Plan (plan ministériel)
- A report on the plans and expected performance of an appropriated department over a 3-year period. Departmental Plans are tabled in Parliament each spring.
- Departmental Results Report (rapport sur les résultats ministériels)
- A report on an appropriated department's actual accomplishments against the plans, priorities and expected results set out in the corresponding Departmental Plan.
- evaluation (évaluation)
- In the Government of Canada, the systematic and neutral collection and analysis of evidence to judge merit, worth or value. Evaluation informs decision making, improvements, innovation and accountability. Evaluations typically focus on programs, policies and priorities and examine questions related to relevance, effectiveness and efficiency. Depending on user needs, however, evaluations can also examine other units, themes and issues, including alternatives to existing interventions. Evaluations generally employ social science research methods.
- experimentation (expérimentation)
- Activities that seek to explore, test and compare the effects and impacts of policies, interventions and approaches to inform evidence-based decision making by learning what works and what does not.
- full-time equivalent (équivalent temps plein)
- A measure of the extent to which an employee represents a full person-year charge against a departmental budget. Full-time equivalents are calculated as a ratio of assigned hours of work to scheduled hours of work. Scheduled hours of work are set out in collective agreements.
- Gender-based Analysis Plus (GBA+) (analyse comparative entre les sexes plus [ACS+])
- An analytical approach used to assess how diverse groups of women, men and gender-diverse people may experience policies, programs and initiatives. The "plus" in GBA+ acknowledges that gender-based analysis goes beyond biological (sex) and socio-cultural (gender) differences. We all have multiple identity factors that intersect to make us who we are; GBA+ considers many other identity factors, such as race, ethnicity, religion, age, and mental or physical disability. Examples of GBA+ processes include using data disaggregated by sex, gender and other intersecting identity factors in performance analysis, and identifying any impacts of the program on diverse groups of people, with a view to adjusting these initiatives to make them more inclusive.
- government-wide priorities (priorités pangouvernementales)
- For the purpose of the 2017–18 Departmental Results Report, those high-level themes outlining the government's agenda in the 2015 Speech from the Throne, namely: Growth for the Middle Class; Open and Transparent Government; A Clean Environment and a Strong Economy; Diversity is Canada's Strength; and Security and Opportunity.
- horizontal initiatives (initiative horizontale)
- An initiative where 2 or more departments are given funding to pursue a shared outcome, often linked to a government priority.
- Management, Resources and Results Structure (structure de la gestion, des ressources et des résultats)
- A comprehensive framework that consists of an organization's inventory of programs, resources, results, performance indicators and governance information. Programs and results are depicted in their hierarchical relationship to each other and to the Strategic Outcome(s) to which they contribute. The Management, Resources and Results Structure is developed from the Program Alignment Architecture.
- non-budgetary expenditures (dépenses non budgétaires)
- Net outlays and receipts related to loans, investments and advances, which change the composition of the financial assets of the Government of Canada.
- performance (rendement)
- What an organization did with its resources to achieve its results, how well those results compare to what the organization intended to achieve, and how well lessons learned have been identified.
- performance indicator (indicateur de rendement)
- A qualitative or quantitative means of measuring an output or outcome, with the intention of gauging the performance of an organization, program, policy or initiative respecting expected results.
- performance reporting (production de rapports sur le rendement)
- The process of communicating evidence-based performance information. Performance reporting supports decision making, accountability and transparency.
- plan (plan)
- The articulation of strategic choices, which provides information on how an organization intends to achieve its priorities and associated results. Generally a plan will explain the logic behind the strategies chosen and tend to focus on actions that lead up to the expected result.
- planned spending (dépenses prévues)
- For Departmental Plans and Departmental Results Reports, planned spending refers to those amounts that receive Treasury Board approval by February 1. Therefore, planned spending may include amounts incremental to planned expenditures presented in the Main Estimates.
- A department is expected to be aware of the authorities that it has sought and received. The determination of planned spending is a departmental responsibility, and departments must be able to defend the expenditure and accrual numbers presented in their Departmental Plans and Departmental Results Reports.
- priorities (priorités)
- A plan or project that an organization has chosen to focus and report on during the planning period. Priorities represent the things that are most important or what must be done first to support the achievement of the desired Strategic Outcome(s) or Departmental Results.
- program (programme)
- A group of related resource inputs and activities that are managed to meet specific needs and to achieve intended results and that are treated as a budgetary unit.
- Program Alignment Architecture (architecture d'alignement des programmes)
- A structured inventory of an organization's programs depicting the hierarchical relationship between programs and the Strategic Outcome(s) to which they contribute.
- results (résultat)
- An external consequence attributed, in part, to an organization, policy, program or initiative. Results are not within the control of a single organization, policy, program or initiative; instead they are within the area of the organization's influence.
- statutory expenditures (dépenses législatives)
- Expenditures that Parliament has approved through legislation other than appropriation acts. The legislation sets out the purpose of the expenditures and the terms and conditions under which they may be made.
- Strategic Outcome (résultat stratégique)
- A long-term and enduring benefit to Canadians that is linked to the organization's mandate, vision and core functions.
- sunset program (programme temporisé)
- A time-limited program that does not have an ongoing funding and policy authority. When the program is set to expire, a decision must be made whether to continue the program. In the case of a renewal, the decision specifies the scope, funding level and duration.
- target (cible)
- A measurable performance or success level that an organization, program or initiative plans to achieve within a specified time period. Targets can be either quantitative or qualitative.
- voted expenditures (dépenses votées)
- Expenditures that Parliament approves annually through an Appropriation Act. The Vote wording becomes the governing conditions under which these expenditures may be made.
- Date modified:
